


niman
-
Posts
74,774 -
Joined
-
Last visited
-
Days Won
31
Content Type
Profiles
Forums
Articles
Events
Blogs
Everything posted by niman
-
33,073 Confirmed Cases 2,440 CDC Expanded Case Definition (Probable) 35,513** Total Cases 6,049 Number of Hospitalizations in Ohio 1,944 Confirmed Deaths 211 CDC Expanded Death Definition (Probable) 2,155 Total Deaths 1,556 Number of ICU Admissions <1-109 Age Range 49 Median Age 52%* Sex - Males 47%* https://coronavirus.ohio.gov/wps/portal/gov/covid-19/home
-

Maryland COVID Cases Increase To 52,778 Deaths To 2,532
niman posted a topic in Maryland (2019-nCoV)
COVID-19 Statistics in Maryland Number of confirmed cases : 52,778 Number of persons tested negative : 249,103 Total testing volume : 348,773 Number of confirmed deaths : 2,411 Number of probable deaths : 121 Currently hospitalized : 1,183 Acute care : 704 Intensive care : 479 Ever hospitalized : 8,738 Released from isolation : 3,764 Cases and Deaths Data Breakdown: Parenthesis = Confirmed death, laboratory-confirmed positive COVID-19 test result Asterisk = Probable death, death certificate lists COVID-19 as the cause of death but not yet confirmed by a laboratory test NH = Non-Hispanic By County Percent positive testing, all jurisdictions County Cases Deaths Allegany 178 (17) Anne Arundel 3,785 (165) 9* Baltimore City 5,664 (250) 8* Baltimore County 6,065 (329) 15* Calvert 341 (17) 1* Caroline 259 (1) Carroll 913 (89) 1* Cecil 371 (23) Charles 1,108 (71) 1* Dorchester 142 (3) Frederick 1,911 (98) 7* Garrett 10 Harford 882 (48) 3* Howard 1,928 (54) 4* Kent 173 (19) Montgomery 11,361 (572) 40* Prince George's 15,220 (517) 24* Queen Anne's 160 (13) St. Mary's 499 (22) Somerset 73 (2) Talbot 99 (2) Washington 469 (14) Wicomico 953 (30) Worcester 214 (12) 1* Data not available (43) 7* By Age Range and Gender Age/Gender Cases Deaths 0-9 1,274 10-19 2,319 (1) 20-29 7,312 (13) 1* 30-39 9,815 (30) 4* 40-49 9,505 (69) 3* 50-59 8,596 (168) 9* 60-69 6,203 (385) 11* 70-79 3,986 (600) 17* 80+ 3,768 (1,102) 69* Data not available (43) 7* Female 27,506 (1,184) 66* Male 25,272 (1,227) 55* By Race and Ethnicity Race/Ethnicity Cases Deaths African-American (NH) 15,188 (995) 40* Asian (NH) 997 (93) 6* White (NH) 10,299 (1,016) 59* Hispanic 13,377 (226) 7* Other (NH) 2,654 (31) Data not available 10,263 (50) 9* https://coronavirus.maryland.gov/ -
Harris County 12,220 Dallas County 10,006 Tarrant County 5,463 Travis County 3,232 Bexar County 2,825 El Paso County 2,764 Potter County 2,321 Fort Bend County 1,861 Walker County 1,455 Denton County 1,357 Collin County 1,297 Montgomery County 954 Brazoria County 907 Galveston County 807 Cameron County 764 Lubbock County 691 Moore County 686 Randall County 674 Williamson County 612 Hidalgo County 560 Webb County 546 Jefferson County 544 Brazos County 477 Titus County 451 Jones County 401 Bell County 362 Grayson County 333 Hays County 329 Ellis County 317 Nacogdoches County 287 Coryell County 281 Nueces County 274 Bowie County 265 Harrison County 245 Taylor County 235 Kaufman County 223 Grimes County 215 Gregg County 213 Bastrop County 211 Angelina County 205 Smith County 204 Washington County 202 Shelby County 201 Panola County 179 Johnson County 175 Rockwall County 167 Deaf Smith County 164 Victoria County 160 Ector County 154 Lamar County 145 Hardin County 138 Guadalupe County 133 Gonzales County 129 Midland County 129 McLennan County 118 Maverick County 116 Houston County 114 Gray County 98 Orange County 98 Liberty County 95 Comal County 94 Pecos County 93 Hunt County 88 Wichita County 84 Camp County 83 Parker County 76 Medina County 73 Anderson County 72 Red River County 70 Tom Green County 69 Chambers County 68 Matagorda County 67 Caldwell County 65 Parmer County 59 Brown County 58 Hale County 58 Wharton County 58 Henderson County 57 Waller County 57 Navarro County 56 Polk County 56 Rusk County 55 Ochiltree County 49 Wise County 46 Cherokee County 44 Dawson County 42 Fannin County 41 San Augustine County 38 Wilson County 38 Atascosa County 37 Burnet County 37 Calhoun County 37 Frio County 37 Hutchinson County 36 Fayette County 34 Castro County 33 San Patricio County 33 Starr County 33 Mason County 32 Van Zandt County 31 Cass County 29 Jasper County 29 Kendall County 29 Wood County 29 Milam County 28 Andrews County 27 Hockley County 27 Hood County 27 Austin County 26 Donley County 26 Hopkins County 26 Morris County 26 Upshur County 26 Dallam County 25 Burleson County 24 Hill County 24 Lee County 24 Limestone County 24 Scurry County 24 Sherman County 24 Crane County 23 Colorado County 22 Hansford County 19 Kerr County 19 Jackson County 18 Val Verde County 18 Bailey County 17 DeWitt County 17 Erath County 17 Swisher County 17 Kleberg County 16 Lamb County 16 Marion County 16 Willacy County 16 Franklin County 15 Trinity County 15 Wheeler County 15 Cooke County 14 Sabine County 14 San Jacinto County 14 Palo Pinto County 13 Terry County 13 Comanche County 12 Lavaca County 12 Tyler County 12 Uvalde County 12 Blanco County 11 Floyd County 11 Hartley County 11 Zavala County 11 Freestone County 10 Leon County 10 Bee County 9 Callahan County 9 Jim Wells County 9 Lampasas County 9 Live Oak County 9 Montague County 9 Zapata County 9 Hamilton County 8 Howard County 8 Madison County 8 Robertson County 8 Bosque County 7 Falls County 7 Gaines County 7 Goliad County 7 Lynn County 7 Reeves County 7 Wilbarger County 7 Bandera County 6 Carson County 6 Eastland County 6 Aransas County 5 Collingsworth County 5 Duval County 5 Garza County 5 Gillespie County 5 Newton County 5 Cottle County 4 Crosby County 4 Jack County 4 Jim Hogg County 4 Karnes County 4 La Salle County 4 Nolan County 4 Stephens County 4 Young County 4 Armstrong County 3 Clay County 3 Coleman County 3 Haskell County 3 Llano County 3 McCulloch County 3 Martin County 3 Oldham County 3 Rains County 3 Refugio County 3 Runnels County 3 Winkler County 3 Yoakum County 3 Childress County 2 Fisher County 2 Hall County 2 Hudspeth County 2 Lipscomb County 2 Reagan County 2 Roberts County 2 Archer County 1 Brewster County 1 Briscoe County 1 Brooks County 1 Cochran County 1 Coke County 1 Concho County 1 Delta County 1 Dickens County 1 Dimmit County 1 Glasscock County 1 Hardeman County 1 Hemphill County 1 Kimble County 1 Kinney County 1 Knox County 1 Mills County 1 Mitchell County 1 Motley County 1 Presidio County 1 San Saba County 1 Shackelford County 1 Ward County 1 https://txdshs.maps.arcgis.com/apps/opsdashboard/index.html#/ed483ecd702b4298ab01e8b9cafc8b83
-
As of May 30, 2020, at 8:30 PM, the total number of laboratory-confirmed and probable cases of COVID19 reported among Connecticut resident is 42201. Four hundred eighty-one patients are currently hospitalized with laboratory-confirmed COVID-19. There have been 3944 COVID-19-associated deaths. Day-to-day changes reflect newly reported cases, deaths, and tests that occurred over the last several days to week. All data in this report are preliminary; data for previous dates will be updated as new reports are received and data errors are corrected. Hospitalization data were collected by the Connecticut Hospital Association. Deaths* reported to either the OCME or DPH are included in the daily COVID-19 update. Overall Summary Total Change Since Yesterday COVID-19 Cases 42201 +179 COVID-19-Associated Deaths 3944 +32 Patients Currently Hospitalized with COVID-19 481 -52 COVID-19 PCR Tests Reported 250046 +3111 COVID-19 Cases and Associated Deaths by County of Residence As of 05/30/20 8:30pm. Includes patients tested at the State Public Health Laboratory, hospital, and commercial laboratories. County COVID-19 Cases COVID-19-Associated Deaths Fairfield County 15549 1277 Hartford County 10296 1250 Litchfield County 1397 133 Middlesex County 1104 152 New Haven County 11323 972 New London County 1078 89 Tolland County 836 57 Windham County 384 14 Pending address validation 234 0 Total 42201 3944 National COVID-19 statistics and information about preventing spread of COVID-19 are available from the Centers for Disease Control and Prevention. https://portal.ct.gov/-/media/Coronavirus/CTDPHCOVID19summary5312020.pdf?la=en
-
Filtered to: Louisiana 39,916 Cases Reported 2,686 Deaths Reported Tests Performed 21,102 by State Lab Commercial Tests 354,007 Performed Statewide Indicator Presumed Recovered* 28,700 as of 5/24/2020 Reported COVID-19 Patients in Hospitals 678 84 of those on ventilators http://ldh.la.gov/coronavirus/
-
Coronavirus Disease 2019 (COVID-19) in Illinois Test Results Positive 120,260 Deaths 5,390 Total Tests Performed* 898,259 Recovery Rate** 92% *Total nucleic acid-based tests performed and reported electronically for testing of COVID-19 at IDPH, commercial or hospital laboratories. All numbers displayed are provisional and will change. http://www.dph.illinois.gov/topics-services/diseases-and-conditions/diseases-a-z-list/coronavirus ** Recovered cases are defined as persons with initial positive specimen collection date > 42 days who have not expired. Recovery rate is calculated as the recovered cases divided by the sum of recovered cases and deceased cases. Information regarding the number of persons under investigation updated on 5/31/2020. Information to be updated daily.
-
Michigan COVID Cases Increase To 57,397 Deaths To 5,491
niman posted a topic in Michigan (2019-nCoV)
This information is updated daily at 3 p.m., with COVID-19 results included as of 10 a.m. https://www.michigan.gov/coronavirus/0,9753,7-406-98163_98173---,00.html Confirmed COVID-19 Cases by Jurisdiction updated 5/31/2020 County Confirmed Cases Reported Deaths Alcona 15 1 Allegan 218 6 Alpena 94 9 Antrim 12 Arenac 34 1 Baraga 1 Barry 63 2 Bay 310 23 Benzie 4 Berrien 626 49 Branch 121 2 Calhoun 371 22 Cass 83 3 Charlevoix 15 1 Cheboygan 21 1 Chippewa 2 Clare 19 2 Clinton 139 11 Crawford 58 5 Delta 17 2 Detroit City 11041 1374 Dickinson 5 2 Eaton 190 6 Emmet 21 2 Genesee 2013 252 Gladwin 18 1 Gogebic 5 1 Grand Traverse 27 5 Gratiot 74 10 Hillsdale 169 24 Houghton 6 Huron 48 1 Ingham 738 26 Ionia 148 4 Iosco 94 9 Isabella 77 7 Jackson 448 28 Kalamazoo 844 55 Kalkaska 19 2 Kent 3715 85 Lake 6 Lapeer 190 30 Leelanau 11 Lenawee 153 4 Livingston 395 26 Luce 3 Mackinac 8 Macomb 6695 810 Manistee 11 Marquette 56 11 Mason 32 Mecosta 21 2 Menominee 8 Midland 82 8 Missaukee 16 1 Monroe 474 19 Montcalm 66 1 Montmorency 5 Muskegon 643 36 Newaygo 105 Oakland 8396 988 Oceana 85 2 Ogemaw 21 1 Osceola 11 Oscoda 5 1 Otsego 102 10 Ottawa 774 34 Presque Isle 11 Roscommon 21 Saginaw 1038 108 Sanilac 41 5 Schoolcraft 4 Shiawassee 240 26 St Clair 449 41 St Joseph 119 2 Tuscola 187 23 Van Buren 144 6 Washtenaw 1336 99 Wayne 9374 1087 Wexford 11 3 MDOC* 3933 69 FCI** 146 4 Unknown 4 Out of State 42 Grand Total 57397 5491 *Michigan Department of Corrections **Federal Correctional Institute*Michigan Department of Corrections Note on cumulative counts: This report is provisional and subject to change. As public health investigations of individual cases continue, there will be corrections to the status and details of referred cases that result in changes to this report.City of Detroit and Wayne County are reported separately Note on the deaths: Deaths must be reported by health care providers, medical examiners/coroners, and recorded by local health departments in order to be counted. Note on jurisdictional classification: In order to provide more accurate data, the “Other” jurisdiction category will no longer be used. Michigan Department of Corrections cases will be listed under “MDOC”. Federal Correctional Institution cases will be listed under “FCI”. Note on Case Fatality Rate: The case fatality rate is the number of people who have died from causes associated with COVID-19 out of the total number of people with confirmed COVID-19 infections. It is used as one measure of illness severity. Several factors can affect this number. Until recently, COVID-19 lab testing has prioritized for hospitalized individuals due to limited testing availability. As a result, COVID-19 infections were identified more often in people who were more severely ill. This would lead to a higher case fatality rate. As more people with mild illness are tested, it is likely the case fatality rate will go down. Links DAILY COUNTS LAB TESTING DATA ABOUT PLACES LONG TERM CARE FACILITIES CORONAVIRUS SYMPTOMS Cumulative Total of Recovered COVID-19 Cases (as of 5/29/2020): 38,099 Cumulative Total of Recovered COVID-19 Cases (as of 05/29/2020): 38,099 Note on recovery: During this response, MDHHS is reviewing vital records statistics to identify any laboratory confirmed COVID-19 cases who are 30 days out from their onset of illness to represent recovery status. As the pandemic continues to impact Michigan, this pool will expand to include more cases. Recovered is defined as the number of persons with a confirmed COVID-19 diagnosis who are alive 30 days post-onset (or referral date if onset is not available). The number of persons recovered on May 29, 2020 represents COVID-19 confirmed individuals with an onset date on or prior to April 29, 2020. If an individual dies from a COVID-related cause >30 days from onset/referral, they are removed from the number of persons recovered. These numbers will be updated every Saturday. Source: Michigan Disease Surveillance System and Vital Records Age Data of Overall Deceased Average Age 75.3 years Median Age 77 years Age Range 5-107 years Overall Case Fatality Rate Statewide Confirmed Cases 10% Cases by Sex Sex Percentage of Overall Cases by Sex Percentage of Deceased Cases by Sex Male 47% 53% Female 52% 47% Unknown <1% <1% Totals may not add to 100% due to rounding Cases by Age Age Percentage of Overall Cases by Age Percentage of Deceased Cases by Age 0 to 19 3% <1% 20 to 29 12% <1% 30 to 39 14% 1% 40 to 49 16% 3% 50 to 59 18% 8% 60 to 69 16% 18% 70 to 79 11% 27% 80+ 11% 42% Unknown <1% <1% Totals may not add to 100% due to rounding Cases by Race Race Percentage of Overall Cases by Race Percentage of Deceased Cases by Race American Indian or Alaska Native <1% <1% Asian/Pacific Islander 2% 1% Black or African American 31% 40% Caucasian 37% 51% Multiple Races 8% 2% Other 5% 2% Unknown 16% 4% Totals may not add to 100% due to rounding Cases by Hispanic/Latino Ethnicity Hispanic/Latino Ethnicity Percentage of Overall Cases by Ethnicity Percentage of Deceased Cases by Ethnicity Hispanic/Latino 7% 2% Non-Hispanic Latino 63% 81% Unknown 30% 16% Totals may not add to 100% due to rounding Cases by Arab Ethnicity Arab Ethnicity Percentage of Overall Cases by Ethnicity Percentage of Deceased Cases by Ethnicity Arab 2% 1% Non-Arab 37% 39% Unknown 61% 59% Totals may not add to 100% due to rounding -
https://www.mass.gov/doc/covid-19-dashboard-may-31-2020/download
-
https://experience.arcgis.com/experience/96dd742462124fa0b38ddedb9b25e429
-
https://www.azdhs.gov/preparedness/epidemiology-disease-control/infectious-disease-epidemiology/covid-19/dashboards/index.php
-
https://covid19tracker.health.ny.gov/views/NYS-COVID19-Tracker/NYSDOHCOVID-19Tracker-Map?%3Aembed=yes&%3Atoolbar=no&%3Atabs=n
-
Hudson County: 18419 Positive Test Results 1183 Deaths Bergen County: 18272 Positive Test Results 1579 Deaths Essex County: 17629 Positive Test Results 1664 Deaths Passaic County: 16170 Positive Test Results 928 Deaths Middlesex County: 15921 Positive Test Results 994 Deaths Union County: 15821 Positive Test Results 1073 Deaths Ocean County: 8748 Positive Test Results 739 Deaths Monmouth County: 8219 Positive Test Results 597 Deaths Mercer County: 6933 Positive Test Results 472 Deaths Camden County: 6510 Positive Test Results 338 Deaths Morris County: 6463 Positive Test Results 615 Deaths Burlington County: 4627 Positive Test Results 291 Deaths Somerset County: 4583 Positive Test Results 419 Deaths Cumberland County: 2298 Positive Test Results 73 Deaths Gloucester County: 2234 Positive Test Results 147 Deaths Atlantic County: 2214 Positive Test Results 159 Deaths Warren County: 1160 Positive Test Results 131 Deaths Sussex County: 1110 Positive Test Results 149 Deaths Hunterdon County: 993 Positive Test Results 60 Deaths Salem County: 634 Positive Test Results 38 Deaths Cape May County: 617 Positive Test Results 49 Deaths https://www.nj.gov/health/cd/topics/covid2019_dashboard.shtml
-
COVID-19 Data for Pennsylvania* * Map, tables, case counts and deaths last updated at 12:00 p.m. on 5/31/2020 Source: Pennsylvania National Electronic Disease Surveillance System (PA-NEDSS) as of 12:00 a.m. on 5/31/2020 Page last updated: 12:00 p.m. on 5/31/2020 View the beta version of the Pennsylvania COVID-19 Dashboard. Case Counts, Deaths, and Negatives Total Cases* Deaths Negative** Recovered*** 71,926 5,555 383,111 67% * Total case counts include confirmed and probable cases. ** Negative case data only includes negative PCR tests. Negative case data does not include negative antibody tests. *** Individuals who have recovered is determined using a calculation, similar to what is being done by several other states. If a case has not been reported as a death, and it is more than 30 days past the date of their first positive test (or onset of symptoms) then an individual is considered recovered. Confirmed Cases Probable Case by Definition and High-Risk Exposure Probable Case by Serology Test and Either Symptoms or High-Risk Exposure 69,916 2,010 620 Hospital Data View hospital dataOpens In A New Window (desktop version) View hospital dataOpens In A New Window (mobile version) Trajectory Animations COVID-19 Trajectory Animations Positive Cases by Age Range to Date Age Range Percent of Cases* 0-4 < 1% 5-12 < 1% 13-18 2% 19-24 6% 25-49 37% 50-64 25% 65+ 28% * Percentages may not total 100% due to rounding Hospitalization Rates by Age Range to Date Age Range Percent of Cases* 0-4 < 1% 5-12 < 1% 13-18 < 1% 19-24 1% 25-49 16% 50-64 26% 65+ 56% * Percentages may not total 100% due to rounding Death Data View COVID-19 death data County Case Counts to Date County Total Cases Negatives Adams 251 3098 Allegheny 1911 30488 Armstrong 62 1250 Beaver 590 3791 Bedford 39 769 Berks 4061 12272 Blair 50 2805 Bradford 46 1569 Bucks 5082 20119 Butler 230 3742 Cambria 57 3872 Cameron 2 128 Carbon 235 2387 Centre 153 2135 Chester 2729 13092 Clarion 27 679 Clearfield 39 1117 Clinton 56 602 Columbia 348 1364 Crawford 29 1087 Cumberland 629 5639 Dauphin 1277 10168 Delaware 6461 21311 Elk 6 329 Erie 279 5068 Fayette 95 3362 Forest 7 86 Franklin 774 5212 Fulton 15 228 Greene 27 795 Huntingdon 230 872 Indiana 91 1434 Jefferson 9 526 Juniata 95 345 Lackawanna 1547 6284 Lancaster 3161 16043 Lawrence 80 1355 Lebanon 969 4589 Lehigh 3765 14395 Luzerne 2736 11150 Lycoming 164 2293 McKean 12 617 Mercer 107 1631 Mifflin 59 1248 Monroe 1319 5991 Montgomery 7061 35108 Montour 52 3259 Northampton 3083 13567 Northumberland 192 1441 Perry 59 776 Philadelphia 18426 59136 Pike 476 2030 Potter 4 149 Schuylkill 631 5053 Snyder 45 410 Somerset 38 1855 Sullivan 3 97 Susquehanna 109 810 Tioga 17 571 Union 59 1174 Venango 9 559 Warren 3 391 Washington 139 4503 Wayne 119 1046 Westmoreland 449 9499 Wyoming 34 497 York 1007 13843 View as a clickable county or zip code level mapOpens In A New Window Incidence by County Incidence is calculated by dividing the current number of confirmed and probable COVID-19 cases reported to the Department by the 2018 county population data available from the Bureau of Health Statistics. The counties are divided into 6 relatively equally-sized groups based on their incidence rate (i.e. sestiles). Cases are determined using a national COVID-19 case definition. There currently is no way to estimate the true number of infected persons. Incidence rates are based on the number of known cases, not the number of true infected persons. Case Counts by Sex to Date Sex Positive Cases Percent of Cases* Female 39,432 55% Male 31,785 44% Neither 3 0% Not reported 706 1% * Percentages may not total 100% due to rounding Case Counts by Race to Date* Race Positive Cases Percent of Cases** African American/Black 8777 12% Asian 1035 1% White 19,847 28% Other 437 1% Not reported 41,830 58% * 58% of race is not reported. Little data is available on ethnicity. ** Percentages may not total 100% due to rounding Case Counts by Region to Date Region Positive Negative Inconclusive Northcentral 1063 15064 17 Northeast 13114 58157 165 Northwest 516 13573 20 Southcentral 5264 49592 81 Southeast 46502 182134 965 Southwest 3457 64591 46 EpiCurve by Region Case counts are displayed by the date that the cases were first reported to the PA-NEDSS surveillance system. Case counts by date of report can vary significantly from day to day for a variety of reasons. In addition to changes due to actual changes in disease incidence, trends are strongly influenced by testing patterns (who gets tested and why), testing availability, lab analysis backlogs, lab reporting delays, new labs joining our electronic laboratory reporting system, mass screenings, etc. Trends need to be sustained for at least 2-3 weeks before any conclusions can be made regarding the progress of the pandemic. COVID-19 Cases Associated with Nursing Homes and Personal Care Homes to Date This data represents long-term care facilities in Pennsylvania, including Department of Health and Department of Human Services regulated facilities. COVID-19 Long-Term Care Facilities Data (updated 5/26/2020 at 3:30 p.m.) https://www.health.pa.gov/topics/disease/coronavirus/Pages/Cases.aspx
-
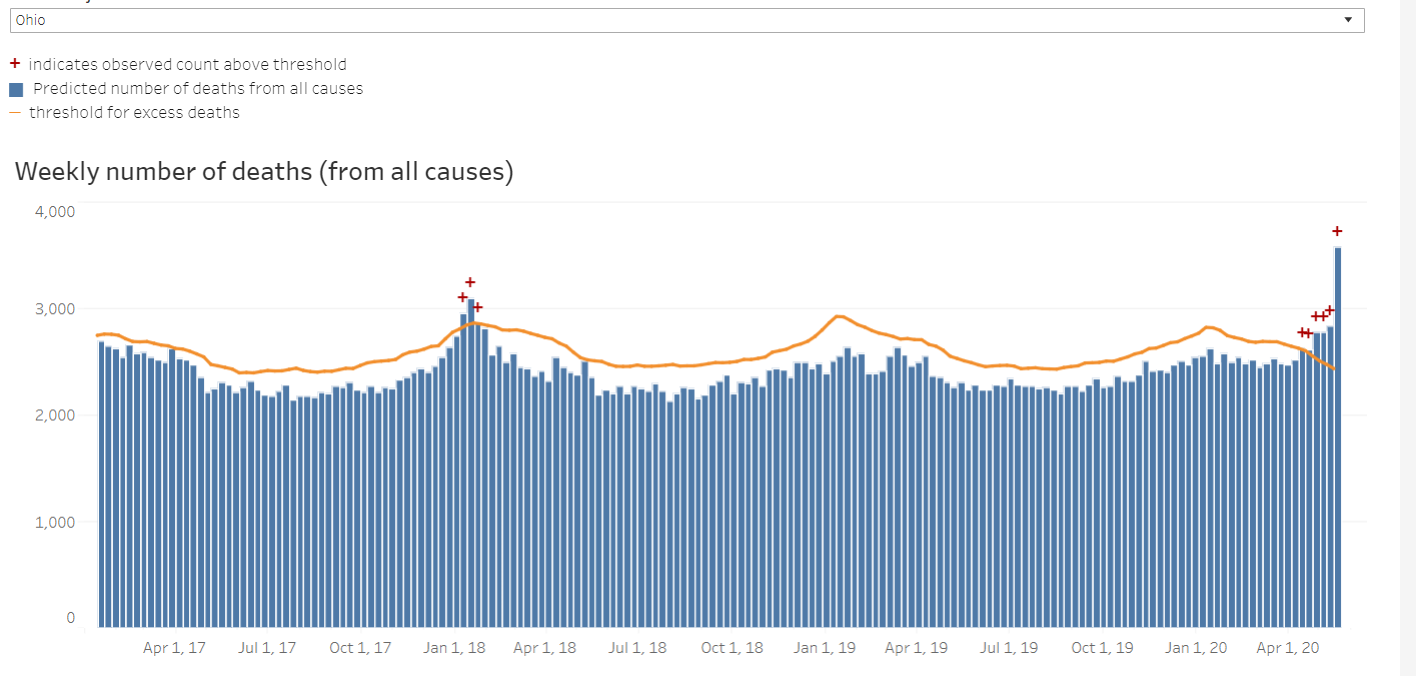
Ohio Excessive Deaths Spike In Week Ending May 16
niman replied to niman's topic in Ohio (2019-nCoV)
-
Ohio Excessive Deaths Spike In Week Ending May 16
niman replied to niman's topic in Ohio (2019-nCoV)
-
Latest CDC update on excessive deaths show a spike in Ohio in week ending May 16. Data is based on death certificates and data for week ending May 16 are likely incomplete. https://www.cdc.gov/nchs/nvss/vsrr/covid19/excess_deaths.htm
-
https://coronavirus.iowa.gov/pages/case-counts
-
https://dph.georgia.gov/covid-19-daily-status-report
-
https://alpublichealth.maps.arcgis.com/apps/opsdashboard/index.html#/6d2771faa9da4a2786a509d82c8cf0f7
-
By LOS ANGELES TIMES STAFF UPDATED MAY 30, 9:38 P.M. PACIFIC 109,982 confirmed cases +3,031 on Saturday 4,145 deaths +57 on Saturday The coronavirus pandemic has spread rapidly across California. Experts say the true number of people infected is unknown and likely much higher than official tallies. To better understand the spread of the virus, The Times is conducting an independent, continual survey of dozens of local health agencies across the state. What we know Tallies continue to climb. Over the past week, the state has averaged 2,475 new cases and 58.3 new deaths per day. The focus is shifting to SoCal. Los Angeles County has recorded 51% of new cases in the last two weeks, while home to only a quarter of the state's population. Hospitals are holding up. The number of patients has remained steady, a goal of the stay-at-home policies. Testing is increasing. Numbers are rising, but the state is still below its goal of averaging more than 60,000 tests per day. The highest toll is among seniors. Roughly 79% of the dead were 65 or older. At least 2,090 were living at a nursing home. The state has started to gradually reopen. Many counties are opening nonessential businesses. California's totals sit far below New York, where more than 29,700 people have died. California counties Alameda Contra Costa Fresno Imperial Kern Kings Los Angeles Orange Riverside Sacramento San Bernardino San Diego San Francisco San Joaquin San Mateo Santa Barbara Santa Clara Sonoma Tulare Ventura Other trackers Beach closures Housing homeless people Reopenings by county The lives lost More coverage Symptoms How it spreads Get our newsletter Jump to a section Trends Maps Hospitals Tests Demographics Nursing homes Reopenings State rankings The latest trends The number of cases in California is now on pace to double every 27.6 days, a number used to measure how quickly the virus is spreading. Coronavirus can infect people so rapidly that government officials have issued shutdown orders aimed at slowing the growth of new cases and flattening this line. CasesDeaths Cumulative cases Feb.MarchAprilMay020,00040,00060,00080,000100,000 Times survey of county and local health departments Local governments announce new cases and deaths each day, though bottlenecks in testing and reporting lags can introduce delays. For instance, some agencies do not report new totals on weekends, leading to lower numbers on those days. New cases by day Feb.MarchAprilMay01,0002,0003,0007-dayaverage7-dayaverage Deaths by day Feb.MarchAprilMay0501007-dayaverage7-dayaverage The lines above are seven-day averages. They offer a more stable view of the trend than daily totals. That's why experts wait for lines like these to flatten before they say conditions are improving. The rate varies from county to county, but most areas are still reporting new cases every day. The chart below is adjusted to show how quickly new cases are being confirmed in each county. A good sign is when a line flattens, which indicates that transmission is slowing in that area. Cumulative cases by county Current doubling time5 days7142130 15 dayssince 10th case304560751020501002005001,0002,0005,00010,00020,00050,000Doublingevery dayDoublingevery dayEvery2 daysEvery2 daysEvery3 daysEvery3 daysEvery weekEvery weekEverymonthEverymonthImperialImperialLos AngelesLos AngelesSan BernardinoSan BernardinoAlamedaAlamedaRiversideRiversideSan JoaquinSan JoaquinSacramentoSacramentoSanta ClaraSanta ClaraAmadorAmadorNevadaNevadaDel NorteDel NorteLakeLakeMendocinoMendocinoSan BenitoSan BenitoButteButteMontereyMontereyPlacerPlacerKingsKingsSan MateoSan MateoTulareTulareYoloYoloMercedMercedSanta CruzSanta CruzYubaYubaMariposaMariposaCalaverasCalaverasInyoInyo This chart tracks cumulative cases after each county confirmed its 10th case. Case counts are plotted on a logarithmic scale, which makes it easier to see when cases level off. Doubling rate is the estimate of how long it would take the county to double its number of cases, given the trend in the last week. Help us track the coronavirus by subscribing Your support makes our reporting possible. Get unlimited digital access today. Already a subscriber? Your contributions help us maintain this page. Thank you. Cases by county and city While initial outbreaks were centered in the San Francisco Bay Area, most new cases and deaths are now concentrated in Southern California. Metric CasesDeaths Time frame Last 14 daysCumulative Confirmed cases01002404408401,71015,360 Hover for more information. Los AngelesLos AngelesSan DiegoSan DiegoSacramentoSacramentoSan FranciscoSan FranciscoReddingRedding State and local officials are closely watching the latest figures as they weigh when and how to reopen. One metric is whether counties have kept the number of new cases reported over the last 14 days to less than 25 per 100,000 residents. Currently, 32 out of the state's 58 counties meet the standard. In the last 14 days Cases Per 100k Status Saturday Deaths Per 100k Saturday Los Angeles » 15,361 152.1 Failing +2,061 542 5.4 +45 Riverside » 1,868 78.4 Failing – 81 3.4 – Orange » 1,798 56.8 Failing +177 61 1.9 +1 San Bernardino » 1,723 80.7 Failing +166 49 2.3 +5 San Diego » 1,717 52.0 Failing +145 58 1.8 +3 Alameda » 895 54.5 Failing +94 13 0.8 – Imperial » 848 470.5 Failing – 12 6.7 – Kern » 648 73.4 Failing +69 13 1.5 +1 Fresno » 558 57.0 Failing +29 19 1.9 – Tulare » 506 109.9 Failing – 20 4.3 – San Mateo » 486 63.5 Failing +43 18 2.4 – San Francisco » 447 51.4 Failing +59 5 0.6 – Kings » 363 241.9 Failing +11 1 0.7 +1 Ventura » 314 37.0 Failing – 8 0.9 – Contra Costa » 304 26.8 Failing +22 4 0.4 – Santa Clara » 304 15.8 Passing +24 6 0.3 +1 Santa Barbara » 247 55.7 Failing – 1 0.2 – San Joaquin » 199 27.2 Failing – 3 0.4 – Sonoma » 184 36.7 Failing – 0 0.0 – Marin 163 62.6 Failing +16 0 0.0 – Sacramento » 162 10.7 Passing +27 2 0.1 – Monterey 155 35.8 Failing +32 2 0.5 – Stanislaus 155 28.7 Failing +19 4 0.7 – Solano 107 24.4 Passing – 6 1.4 – Merced 83 30.8 Failing – 1 0.4 – Santa Cruz 57 20.8 Passing +6 0 0.0 – Del Norte 41 149.5 Failing – 0 0.0 – Madera 34 21.9 Passing – 0 0.0 – San Luis Obispo 29 10.3 Passing – 0 0.0 – Napa 28 19.9 Passing +1 0 0.0 – Yolo 28 13.0 Passing – 2 0.9 – Humboldt 27 19.9 Passing +2 3 2.2 – San Benito 27 45.4 Failing – 0 0.0 – El Dorado 26 13.9 Passing – 0 0.0 – Placer 25 6.6 Passing +15 1 0.3 – Butte 22 9.7 Passing – 0 0.0 – Mendocino 17 19.4 Passing – 0 0.0 – Lake 13 20.3 Passing – 0 0.0 – Glenn 7 25.1 Failing – 0 0.0 – Lassen 5 16.0 Passing – 0 0.0 – Sutter 5 5.2 Passing +1 0 0.0 – Shasta 4 2.2 Passing +2 0 0.0 – Yuba 4 5.3 Passing +1 0 0.0 – Calaveras 2 4.4 Passing – 0 0.0 – Colusa 2 9.3 Passing – 0 0.0 – Mono 2 14.1 Passing – 0 0.0 – Siskiyou 2 4.6 Passing – 0 0.0 – Tehama 2 3.2 Passing – 0 0.0 – Tuolumne 2 3.7 Passing – 0 0.0 – Amador 1 2.6 Passing – 0 0.0 – Inyo 1 5.5 Passing – 0 0.0 – Mariposa 1 5.7 Passing – 0 0.0 – Sierra 1 34.1 Failing – 0 0.0 – Alpine 0 0.0 Passing – 0 0.0 – Modoc 0 0.0 Passing – 0 0.0 – Nevada 0 0.0 Passing – 0 0.0 – Plumas 0 0.0 Passing – 0 0.0 – Trinity 0 0.0 Passing – 0 0.0 – Show less Residents of cities, neighborhoods and regions all across the state have contracted the coronavirus. Here are the latest tallies for 875 places as released by county health departments. Confirmed cases 10 100 500 1,000 2,000 Counties that do not report cases by locality © Mapbox © OpenStreetMap Improve this map The following counties currently do not report cases by locality: Alpine, Colusa, Del Norte, Glenn, Inyo, Lake, Lassen, Madera, Mariposa, Modoc, San Benito, Shasta, Sierra, Siskiyou, Sutter, Tehama, Trinity, Tuolumne and Yuba Filter by countyAlameda Amador Butte Calaveras Contra Costa El Dorado Fresno Humboldt Imperial Kern Kings Los Angeles Marin Mendocino Merced Mono Monterey Napa Nevada Orange Placer Plumas Riverside Sacramento San Bernardino San Diego San Francisco San Joaquin San Luis Obispo San Mateo Santa Barbara Santa Clara Santa Cruz Solano Sonoma Stanislaus Tulare Ventura Yolo City/community Confirmed cases Long Beach 1,947 East Los Angeles 1,063 Glendale 974 Pasadena 923 San Pedro 905 Sylmar 809 Boyle Heights 779 Panorama City 775 Santa Clarita 754 Westlake 754 Palmdale 733 Pacoima 729 Downey 727 Van Nuys 717 North Hollywood 706 Wholesale District 688 South Gate 643 Vernon Central 632 Unincorporated - Florence-Firestone 612 Lynwood 611 Inglewood 591 Compton 590 Lancaster 587 Reseda 578 Castaic 572 Melrose 563 Pico-Union 559 El Monte 536 Pico Rivera 532 Huntington Park 518 Canoga Park 501 Pomona 481 West Vernon 477 North Hills 457 Norwalk 447 Central 424 Florence-Firestone 413 Carson 409 Montebello 406 Bellflower 402 Burbank 399 Hawthorne 398 South Park 394 Torrance 381 West Covina 360 Paramount 345 Vermont Vista 341 Baldwin Park 338 Bell 337 Northridge 337 Temple-Beaudry 337 Granada Hills 322 Whittier 322 Bell Gardens 311 Watts 311 Harvard Park 306 Sun Valley 306 Maywood 298 Winnetka 295 Arleta 288 Century Palms/Cove 281 Koreatown 277 Hollywood 276 Santa Monica 272 Gardena 266 Wilmington 262 Exposition Park 257 Cudahy 252 Wilshire Center 249 Lincoln Heights 247 Athens-Westmont 231 Sherman Oaks 230 East Hollywood 227 West Adams 223 Willowbrook 217 Valley Village 212 Alhambra 204 Highland Park 204 Lake Balboa 203 University Park 198 Little Armenia 194 Chatsworth 193 San Fernando 192 Palms 189 Lakewood 188 Silver Lake 188 Glassell Park 187 West Hollywood 183 Eagle Rock 181 Azusa 176 La Mirada 172 Green Meadows 171 El Sereno 169 Baldwin Hills 168 Covina 168 Tarzana 167 Monterey Park 164 Woodland Hills 162 Monrovia 161 South Whittier 161 West Whittier/Los Nietos 161 Temple City 159 Vermont Knolls 159 Mission Hills 157 Altadena 153 Downtown 152 Culver City 150 Sunland 150 Glendora 148 Harbor Gateway 148 Hyde Park 148 Hacienda Heights 146 West Hills 143 Little Bangladesh 141 Redondo Beach 140 Beverly Hills 139 San Gabriel 139 Historic Filipinotown 138 Harvard Heights 136 Walnut Park 135 Rowland Heights 134 La Puente 131 Valley Glen 130 Encino 129 Duarte 125 South Pasadena 125 Cerritos 124 Tujunga 124 Lawndale 120 Lakeview Terrace 109 Rosemead 109 Mt. Washington 104 West Carson 101 Harbor City 100 Lennox 99 Country Club Park 98 Rancho Palos Verdes 94 Valinda 94 Westchester 94 Porter Ranch 92 Crestview 89 Bassett 87 South El Monte 86 Hollywood Hills 85 Vermont Square 85 Arcadia 83 Mar Vista 82 West Los Angeles 82 Brentwood 81 Hancock Park 80 Studio City 80 Carthay 79 Del Rey 79 Manhattan Beach 79 Commerce 75 Cloverdale/Cochran 72 Crenshaw District 72 Westwood 71 Gramercy Place 70 Santa Fe Springs 70 Venice 66 Calabasas 64 Diamond Bar 64 Hawaiian Gardens 64 Unincorporated - Azusa 64 San Jose Hills 61 San Dimas 60 Victoria Park 60 Unincorporated - Covina 59 Leimert Park 58 Northeast San Gabriel 58 East Rancho Dominguez 57 Elysian Valley 57 Mid-city 57 Pacific Palisades 57 Adams-Normandie 53 Los Feliz 53 Alsace 52 Atwater Village 51 Lomita 51 La Canada Flintridge 50 Echo Park 48 St Elmo Village 47 West Puente Valley 47 Quartz Hill 46 Walnut 46 Covina (Charter Oak) 44 Claremont 42 Miracle Mile 42 Palos Verdes Estates 42 Jefferson Park 39 Canyon Country 38 Beverly Crest 37 Beverlywood 37 Figueroa Park Square 37 Bel Air 36 South Carthay 36 South San Gabriel 36 Agoura Hills 35 Artesia 35 Malibu 35 View Park/Windsor Hills 35 Century City 34 El Segundo 34 Stevenson Ranch 34 El Camino Village 33 La Crescenta-Montrose 32 Signal Hill 31 Thai Town 31 Athens Village 30 Cadillac-Corning 30 La Verne 30 Reseda Ranch 30 Avocado Heights 29 Hermosa Beach 29 Lake Los Angeles 29 Rosewood/West Rancho Dominguez 28 Playa Vista 26 Santa Monica Mountains 24 Chinatown 23 Longwood 23 Manchester Square 23 San Marino 23 Unincorporated - West LA 23 Val Verde 23 Cheviot Hills 22 Unincorporated - Monrovia 21 Wellington Square 21 Ladera Heights 20 Little Tokyo 20 Littlerock/Pearblossom 20 Park La Brea 20 Toluca Lake 20 Lafayette Square 18 Rancho Dominguez 18 Rancho Park 18 Wiseburn 18 Sun Village 17 Angelino Heights 16 Del Aire 16 East La Mirada 16 Elysian Park 16 Unincorporated - Duarte 15 Littlerock 14 Marina del Rey 14 Rolling Hills Estates 14 Unincorporated - Whittier 14 Marina Peninsula 13 North Whittier 12 Reynier Village 12 Acton 11 Shadow Hills 11 Sierra Madre 11 University Hills 11 Exposition 10 Industry 10 La Rambla 10 View Heights 10 Agua Dulce 9 East Whittier 9 Harbor Pines 9 La Habra Heights 9 Unincorporated - Arcadia 9 Kagel/Lopez Canyons 8 Unincorporated - South El Monte 7 Valencia 7 Desert View Highlands 6 North Lancaster 6 Sunrise Village 6 Toluca Terrace 6 Unincorporated - Hawthorne 6 West Rancho Dominguez 6 Westlake Village 6 White Fence Farms 6 Rosewood 5 Unincorporated - La Verne 5 East Pasadena 4 Faircrest Heights 4 Irwindale 4 Lake Manor 4 Regent Square 4 Saugus 4 Twin Lakes/Oat Mountain 4 Unincorporated - Palmdale 4 Bradbury 3 Elizabeth Lake 3 Palisades Highlands 3 Pearblossom/Llano 3 Playa Del Rey 3 Toluca Woods 3 Unincorporated - Glendora 3 Vernon 3 Del Sur 2 Leona Valley 2 Littlerock/Juniper Hills 2 Mandeville Canyon 2 Rolling Hills 2 Santa Catalina Island 2 West Antelope Valley 2 Anaverde 1 Bouquet Canyon 1 Hi Vista 1 Hidden Hills 1 Lake Hughes 1 Llano 1 Newhall 1 Pellissier Village 1 San Pasqual 1 South Antelope Valley 1 Sycamore Square 1 Unincorporated - Angeles National Forest 1 Unincorporated - Del Rey 1 Unincorporated - Pomona 1 Show less Learn more about your county Explore the latest data by visiting our dedicated pages for Los Angeles, Alameda, Contra Costa, Fresno, Imperial, Kern, Kings, Orange, Riverside, Sacramento, San Diego, San Bernardino, San Francisco, San Joaquin, San Mateo, Santa Barbara, Santa Clara, Sonoma, Tulare and Ventura counties. Hospitals and patients One goal of the state's stay-at-home mandate is to slow the virus in hope of preventing hospitals from being overrun. To keep tabs on capacity, the state health department tracks hospitalizations of confirmed and suspected COVID-19 patients. All casesConfirmedSuspected Intensive care and other hospitalized patients April 3001,0002,0003,0004,0005,0006,000 California Department of Public Health In order to reopen, counties must show that hospitalizations have stabilized, meaning they daily increases have averaged less 5% over a seven-day period, or that a county can’t have more than 20 hospitalizations on any single day over a 14-day period. Currently, 55 of the state's 58 counties pass the test. County ICU Other Total Status Los Angeles » 549 1,423 1,972 Declining San Diego » 154 204 358 Declining Orange » 108 216 324 Declining Riverside » 76 194 270 Stable San Bernardino » 63 166 229 Declining Alameda » 54 125 179 Stable Fresno » 22 85 107 Declining Kern » 29 41 70 Stable San Francisco » 25 40 65 Stable Imperial » 18 46 64 Stable Contra Costa » 11 39 50 Declining Santa Clara » 14 34 48 Declining Ventura » 16 31 47 Stable San Mateo » 15 30 45 Declining Sonoma » 8 36 44 Stable San Joaquin » 11 30 41 Declining Tulare » 13 27 40 Stable Sacramento » 17 20 37 Stable Sonoma » 10 21 31 Climbing Marin 7 21 28 Climbing Santa Barbara » 12 15 27 Climbing Stanislaus 9 15 24 Declining Placer 5 18 23 Stable Merced 5 8 13 Declining Humboldt 0 13 13 Low Santa Cruz 1 11 12 Low Monterey 3 8 11 Low Marin 2 8 10 Low San Luis Obispo 6 2 8 Low El Dorado 4 – 6 Declining Butte 2 4 6 Low Mendocino 1 1 2 Stable Calaveras 2 0 2 Low Mariposa 0 2 2 Low Nevada 0 2 2 Declining Lake 0 1 1 Declining Lassen 0 1 1 Low Yuba 0 1 1 Low Siskiyou 0 1 1 Low Plumas 0 1 1 Low Del Norte 0 0 0 Low Madera 0 0 0 Stable Napa 1 0 0 Low Yolo 0 0 0 Low San Benito 0 0 0 Low Glenn 0 0 0 Low Sutter 0 0 0 Low Shasta 0 0 0 Low Colusa 0 0 0 Low Mono 0 0 0 Low Tehama 0 0 0 Low Tuolumne 0 0 0 Low Amador 0 0 0 Low Inyo 0 0 0 Low Sierra 0 0 0 Low Alpine 0 0 0 Low Modoc 0 0 0 Low Trinity 0 0 0 Low Show less Healthcare workers have been hit hard by the virus. Statewide 9,910 have tested positive as of Saturday, accounting for 9% of total infections. The number has continued to grow since state officials started releasing tallies. Confirmed cases among healthcare workers Feb.MarchAprilMay02,0004,0006,0008,00010,000State startsreleasing data California Department of Public Health Testing After a fitful start, Gov. Newsom has promised to dramatically increase coronavirus testing in the state. The governor’s goal is to reach at least 60,000 tests per day. Over the last week, an average of 53,327 tests have been conducted each day. New tests by day April 25May 1May 7May 13May 19May 25020,00040,00060,00080,000Governor's daily goal California Department of Public Health Demographics While Californians of all ages have tested positive for COVID-19, deaths attributed to the virus have tilted heavily toward the elderly. Percentage of cases by age 0-1718-3435-4950-6465-7980+0%10%20%30%40%50% Percentage of deaths by age 0-1718-3435-4950-6465-7980+0%10%20%30%40%50% California Department of Public Health Among most age groups, and especially younger people, blacks and Latinos are dying more often than other races relative to their share of the population. Percentage of population vs. deaths Age: All 0-17 18-34 35-49 50-64 65-79 80+ CasesDeaths 0%20%40%60%80%OtherBlackAsianWhiteLatino Race Deaths Deaths Pct. Population Pct. Latino 135 75.0% 41.5% White 13 7.2% 32.5% Asian 15 8.3% 17.9% Black 15 8.3% 5.9% Other 2 1.2% 2.1% Nursing homes Nursing homes are a tragic focal point of the coronavirus outbreak. At least 2,090 residents have died from COVID-19, 51% of the statewide total. CasesDeaths Deaths at nursing homes vs. elsewhere May 2May 9May 16May 2301,0002,0003,0004,000 California Department of Public Health California's Department of Public Health is currently listing 622 skilled nursing and 84 assisted-living facilities across the state with COVID-19 outbreaks. Filter by countyAlameda Contra Costa Fresno Humboldt Imperial Kern Los Angeles Marin Monterey Napa Orange Placer Riverside Sacramento San Bernardino San Diego San Francisco San Joaquin San Luis Obispo San Mateo Santa Barbara Santa Clara Santa Cruz Shasta Solano Sonoma Stanislaus Tulare Ventura Yolo Residents Facility Cases Deaths AFFINITY HEALTHCARE CENTER 31 12 ALAMEDA CARE CENTER 50 21 ALAMITOS BELMONT REHABILITATION HOSPITAL - - ALCOTT REHABILITATION HOSPITAL - - ALDEN TERRACE CONVALESCENT HOSPITAL 92 21 ALEXANDRIA CARE CENTER 45 22 ALHAMBRA HEALTHCARE & WELLNESS CENTRE, LP 10 or fewer - ALHAMBRA HOSPITAL MEDICAL CENTER D/P SNF - - ANTELOPE VALLEY CARE CENTER 10 or fewer - ARARAT CONVALESCENT HOSPITAL 10 or fewer 10 or fewer ARARAT NURSING FACILITY - - ARBOR GLEN CARE CENTER 52 10 or fewer ASTORIA NURSING AND REHAB CENTER 75 10 or fewer ATLANTIC MEMORIAL HEALTHCARE CENTER 31 10 or fewer AUTUMN HILLS HEALTH CARE CENTER 56 10 or fewer ARARAT HOME OF LOS ANGELES 10 or fewer 10 or fewer ARBOR VISTA 10 or fewer 10 or fewer ATRIA PARK OF PACIFIC PALISADES 10 or fewer 10 or fewer AVANTGARDE SENIOR LIVING OF TARZANA 16 10 or fewer BALDWIN GARDENS NURSING CENTER 17 10 or fewer BAY CREST CARE CENTER - - BEACHSIDE POST ACUTE - 10 or fewer BEACHWOOD POST-ACUTE & REHAB 32 10 or fewer BEACON HEALTHCARE CENTER 10 or fewer - BEL TOOREN VILLA CONVALESCENT HOSPITAL 202 10 or fewer BEL VISTA HEALTHCARE CENTER - - BELL CONVALESCENT HOSPITAL 51 27 BERKLEY VALLEY CONVALESCENT HOSPITAL 10 or fewer - BEVERLY WEST HEALTHCARE 10 or fewer - BIXBY KNOLLS TOWERS HEALTH CARE & REHAB CENTER 10 or fewer 10 or fewer BONNIE BRAE SKILLED NURSING 17 10 or fewer BRIARCREST NURSING CENTER - - BRIER OAK ON SUNSET 10 or fewer 10 or fewer BRIGHTON CARE CENTER 77 16 BROADWAY BY THE SEA 59 13 BROOKDALE NORTHRIDGE - - BROOKFIELD HEALTHCARE CENTER 53 10 or fewer BUENA VENTURA POST ACUTE CARE CENTER 67 15 BURBANK HEALTHCARE AND REHABILITATION CENTER 64 14 BURLINGTON CONVALESCENT HOSPITAL 16 10 or fewer BELMONT VILLAGE ENCINO 25 10 or fewer BELMONT VILLAGE HOLLYWOOD 20 10 or fewer BELMONT VILLAGE RANCHO PALOS VERDES 10 or fewer 10 or fewer BEVERLY HILLS CARMEL RETIREMENT HOTEL 15 10 or fewer BEVERLY HILLS GARDENS CARE CENTER 12 10 or fewer BROOKDALE MONROVIA 10 or fewer 10 or fewer BROOKDALE NORTHRIDGE 22 10 or fewer CALIFORNIA HEALTHCARE AND REHABILITATION CENTER 36 10 or fewer CALIFORNIA POST ACUTE 20 10 or fewer CALIFORNIA POST-ACUTE CARE 33 10 or fewer CAMELLIA GARDENS CARE CENTER 10 or fewer 10 or fewer CANYON OAKS NURSING AND REHABILITATION CENTER 10 or fewer 10 or fewer CASITAS CARE CENTER 53 10 or fewer CATERED MANOR NURSING CENTER 19 10 or fewer CENTINELA SKILLED NURSING & WELLNESS CENTRE 23 10 or fewer CENTURY VILLA, INC. 64 11 CHANDLER CONVALESCENT HOSPITAL 22 10 or fewer CHATSWORTH PARK HEALTH CARE CENTER 27 10 or fewer CLARA BALDWIN STOCKER HOME 10 or fewer 10 or fewer CLEAR VIEW SANITARIUM - - COLLEGE VISTA POST-ACUTE - 10 or fewer COLONIAL CARE CENTER 10 or fewer - COLONIAL GARDENS NURSING HOME 58 10 or fewer COMMUNITY CARE CENTER 10 or fewer - COUNTRY MANOR HEALTHCARE - 10 or fewer COUNTRY VILLA BAY VISTA HEALTHCARE CENTER 10 or fewer - COUNTRY VILLA BELMONT HEIGHTS HEALTHCARE CENTER - - COUNTRY VILLA CLAREMONT HEALTHCARE CENTER 10 or fewer - COUNTRY VILLA EAST NURSING CENTER 56 10 or fewer COUNTRY VILLA LOS FELIZ NURSING CENTER - - COUNTRY VILLA MAR VISTA NURSING CENTER 10 or fewer 10 or fewer COUNTRY VILLA NORTH CONVALESCENT CENTER 10 or fewer 10 or fewer COUNTRY VILLA PAVILION NURSING CENTER 77 10 or fewer COUNTRY VILLA REHABILITATION CENTER 24 10 or fewer COUNTRY VILLA SHERATON NURSING AND REHAB. CENTER 45 12 COUNTRY VILLA SOUTH CONVALESCENT CENTER 139 16 COUNTRY VILLA TERRACE NURSING CENTER 10 or fewer - COUNTRY VILLA WESTWOOD CONVALESCENT CENTER 10 or fewer - COUNTRY VILLA WILSHIRE CONVALESCENT CENTER 10 or fewer - COURTYARD CARE CENTER - - COVINA REHABILITATION CENTER 17 10 or fewer CULVER WEST HEALTH CENTER 38 10 or fewer CARSON SENIOR ASSISTED LIVING 10 or fewer 10 or fewer CEDARS ASSISTED LIVING, THE 19 10 or fewer CITY VIEW LA LLC 10 or fewer - DEL RIO CONVALESCENT CENTER 27 10 or fewer DEL RIO GARDENS CARE CENTER 19 10 or fewer DOWNEY COMMUNITY HEALTH CENTER 42 - DOWNEY POST ACUTE 39 10 or fewer EAST LOS ANGELES DOCTORS HOSPITAL D/P SNF 10 or fewer - EDGEWATER SKILLED NURSING CENTER - - EISENBERG VILLAGE 16 10 or fewer EL ENCANTO HEALTHCARE AND HABILITATION CENTER - 10 or fewer EL MONTE CONVALESCENT HOSPITAL - - EL RANCHO VISTA HEALTH CARE CENTER 46 19 ELMCREST CARE CENTER 23 10 or fewer EMERALD TERRACE CONVALESCENT HOSPITAL 10 or fewer 10 or fewer ENCINO HOSPITAL MEDICAL CENTER - - FLOWER VILLA, INC. 18 10 or fewer FOOTHILL HEIGHTS CARE CENTER 19 10 or fewer FOUNTAIN VIEW SUBACUTE AND NURSING CENTER - - FOUR SEASONS HEALTHCARE & WELLNESS CENTER, LP 83 10 or fewer FALLBROOK GLEN OF WEST HILLS 18 10 or fewer GARDEN VIEW POST-ACUTE REHABILITATION - - GARDENA CONVALESCENT CENTER 34 10 or fewer GEM TRANSITIONAL CARE CENTER 47 14 GLENDALE ADVENTIST MEDICAL CENTER D/P SNF 21 10 or fewer GLENDALE HEALTHCARE CENTER 11 10 or fewer GLENDORA CANYON TRANSITIONAL CARE UNIT - - GLENDORA GRAND, INC. 10 or fewer - GLENHAVEN HEALTHCARE 18 10 or fewer GLENOAKS CONV. HOSPITAL 27 10 or fewer GOLDEN CROSS HEALTH CARE 64 10 or fewer GOLDEN LEGACY CARE CENTER 10 or fewer - GOLDEN STATE COLONIAL HEALTHCARE CENTER - - GOOD SHEPHERD HEALTH CARE CENTER OF SANTA MONICA - - GRANADA HILLS CONVALESCENT HOSPITAL 10 or fewer - GRANADA POST ACUTE 41 10 or fewer GRANCELL VILLAGE OF THE JEWISH HOMES FOR THE AGING 10 or fewer - GRAND PARK CONVALESCENT HOSPITAL 62 25 GRAND VALLEY HEALTH CARE CENTER - - GREATER EL MONTE COMMUNITY HOSPITAL D/P SNF - - GREEN ACRES HEALTHCARE CENTER 10 or fewer 10 or fewer GRIFFITH PARK HEALTHCARE CENTER 10 or fewer - GUARDIAN REHABILITATION HOSPITAL 10 or fewer - GOLDEN ASSISTED LIVING 12 - GRANDVIEW, THE 18 10 or fewer HARBOR POST ACUTE CARE CENTER 33 10 or fewer HAWTHORNE HEALTHCARE & WELLNESS CENTRE, LP 30 10 or fewer HERITAGE REHABILITATION CENTER 10 or fewer - HIGH VALLEY LODGE 10 or fewer - HIGHLAND PARK SKILLED NURSING & WELLNESS CENTRE 10 or fewer - HOLIDAY MANOR CARE CENTER - - HOLLENBECK PALMS - - HOLLYWOOD PREMIER HEALTHCARE CENTER 29 10 or fewer HUNTINGTON DRIVE HEALTH AND REHABILITATION CENTER 10 or fewer - HUNTINGTON HEALTHCARE CENTER 22 14 HUNTINGTON POST ACUTE 61 10 or fewer HYDE PARK HEALTHCARE CENTER 12 10 or fewer IMPERIAL CREST HEALTH CARE CENTER 10 or fewer 10 or fewer IMPERIAL HEALTHCARE CENTER 44 10 or fewer INFINITY CARE OF EAST LOS ANGELES - - INGLEWOOD HEALTH CARE CENTER 36 10 or fewer INLAND VALLEY CARE AND REHABILITATION CENTER 10 or fewer - INTERCOMMUNITY HEALTHCARE & REHABILITATION CENTER - - JOYCE EISENBERG KEEFER MEDICAL CENTER 10 or fewer - JASMIN TERRACE AT EL MOLINO 66 13 KEI-AI LOS ANGELES HEALTHCARE CENTER 72 19 KEI-AI SOUTH BAY HEALTHCARE CENTER 44 13 KINGSLEY MANOR CARE CENTER 19 10 or fewer LA BREA REHABILITATION CENTER 10 or fewer 10 or fewer LA CRESCENTA HEALTHCARE CENTER 18 10 or fewer LA HABRA CONVALESCENT HOSPITAL - - LA PAZ GEROPSYCHIATRIC CENTER 10 or fewer - LAKE BALBOA CARE CENTER 10 or fewer - LAKEVIEW TERRACE 33 10 or fewer LAKEWOOD HEALTHCARE CENTER 43 10 or fewer LANDMARK MEDICAL CENTER 31 - LAS FLORES CONVALESCENT HOSPITAL 10 or fewer 10 or fewer LAUREL PARK BEHAVIORAL HEALTH CENTER 10 or fewer - LAWNDALE HEALTHCARE & WELLNESS CENTRE, LLC 10 or fewer - LEGACY HEALTHCARE CENTER 22 - LEISURE GLEN POST ACUTE CARE CENTER 21 10 or fewer LIGHTHOUSE HEALTHCARE CENTER - - LIVE OAK REHABILITATION CENTER - - LONG BEACH CARE CENTER 54 10 or fewer LONG BEACH HEALTHCARE CENTER 29 10 or fewer LONGWOOD MANOR CONVALESCENT HOSPITAL 10 or fewer 10 or fewer LOS PALOS POST-ACUTE CARE CENTER 10 or fewer - LYNWOOD HEALTHCARE CENTER 41 12 LAKEWOOD PARK MANOR 10 or fewer 10 or fewer MACLAY HEALTHCARE CENTER 51 10 or fewer MAGNOLIA GARDENS CONVALESCENT HOSPITAL 29 10 or fewer MARINA POINTE HEALTHCARE & SUBACUTE 10 or fewer 10 or fewer MAYFLOWER CARE CENTER 10 or fewer - MAYFLOWER GARDENS CONVALESCENT HOSPITAL 21 10 or fewer MAYWOOD SKILLED NURSING & WELLNESS CENTRE 27 10 or fewer MEADOWBROOK BEHAVIORAL HEALTH CENTER 10 or fewer - MEMORIAL HOSPITAL OF GARDENA D/P SNF - - MESA GLEN CARE CENTER - - MID-WILSHIRE HEALTH CARE CENTER 39 11 MISSION CARE CENTER - - MONROVIA GARDENS HEALTHCARE CENTER 56 15 MONTE VISTA HEALTHCARE CENTER 43 12 MONTECITO HEIGHTS HEALTHCARE & WELLNESS CENTRE, LP. 10 or fewer - MONTEREY HEALTHCARE & WELLNESS CENTRE, LP - - MONTEREY PARK CONVALESCENT HOSPITAL 10 or fewer - MONTROSE HEALTHCARE CENTER 35 10 or fewer MONTROSE SPRINGS SKILLED NURSING & WELLNESS CENTER 15 10 or fewer MOTION PICTURE & TELEVISION HOSPITAL D/P SNF 17 10 or fewer MOUNTAIN VIEW CONVALESCENT HOSPITAL 31 14 MONTECEDRO 10 or fewer 10 or fewer MUGUNGWHA SILVER TOWN 10 or fewer 10 or fewer NEW VISTA NURSING AND REHABILITATION CENTER 45 - NORTH VALLEY NURSING CENTER 10 or fewer - NORTHRIDGE CARE CENTER 14 10 or fewer NORWALK MEADOWS NURSING CENTER 10 or fewer 10 or fewer NORWALK SKILLED NURSING & WELLNESS CENTRE 10 or fewer - OAKPARK HEALTHCARE CENTER 10 or fewer 10 or fewer OCEAN POINTE HEALTHCARE CENTER 33 10 or fewer OLYMPIA CONVALESCENT HOSPITAL 62 19 OSAGE HEALTHCARE & WELLNESS CENTRE 24 11 OAKMONT OF SANTA CLARITA 14 10 or fewer OAKMONT OF VALENCIA 17 10 or fewer PACIFIC CARE NURSING CENTER 10 or fewer - PACIFIC PALMS HEALTHCARE 16 10 or fewer PACIFIC POST - ACUTE 10 or fewer - PACIFIC VILLA, INC. 50 10 or fewer PACIFICA HOSPITAL OF THE VALLEY D/P SNF 10 or fewer - PALAZZO POST ACUTE 22 - PALOS VERDES HEALTH CARE CENTER 10 or fewer - PANORAMA GARDENS NURSING AND REHABILITATION CENTER 63 11 PARK AVENUE HEALTHCARE & WELLNESS CENTER - - PARK REGENCY CARE CENTER - - PARKWEST HEALTHCARE CENTER 13 10 or fewer PASADENA CARE CENTER, LLC 10 or fewer - PASADENA GROVE HEALTH CENTER 41 10 or fewer PASADENA PARK HEALTHCARE AND WELLNESS CENTER 10 or fewer 10 or fewer PENN MAR THERAPEUTIC CENTER 17 - PICO RIVERA HEALTHCARE CENTER 10 or fewer - PLAYA DEL REY CENTER 10 or fewer - PRESBYTERIAN INTERCOMMUNITY HOSPITAL D/P SNF - - PRIMROSE POST-ACUTE 24 10 or fewer PROVIDENCE HOLY CROSS MEDICAL CENTER D/P SNF - - PROVIDENCE LITTLE COMPANY OF MARY SUBACUTE CARE CENTER 10 or fewer 10 or fewer PROVIDENCE LITTLE COMPANY OF MARY TRANSITIONAL CARE CENTER 10 or fewer - PROVIDENCE ST. ELIZABETH CARE CENTER - - PACIFICA SENIOR LIVING NORTHRIDGE 41 13 PALMCREST GRAND RESIDENCE 16 10 or fewer RAMONA NURSING & REHABILITATION CENTER 27 10 or fewer RINALDI CONVALESCENT HOSPITAL 19 10 or fewer RIO HONDO SUBACUTE & NURSING CENTER 10 or fewer - RIVIERA HEALTHCARE CENTER 86 10 or fewer ROSE GARDEN HEALTHCARE CENTER 28 10 or fewer ROSE VILLA HEALTHCARE CENTER 10 or fewer - ROYAL CARE SKILLED NURSING CENTER 11 10 or fewer ROYAL CREST HEALTH CARE - - ROYAL GARDENS HEALTHCARE 10 or fewer - ROYAL PALMS POST ACUTE 10 or fewer - ROYAL TERRACE HEALTH CARE - - ROYAL VISTA CARE CENTER 25 10 or fewer ROYALWOOD CARE CENTER 63 15 ROSECRANS VILLA RESIDENTIAL CARE 14 - SAINT VINCENT HEALTHCARE - - SAN GABRIEL CONVALESCENT CENTER - - SANTA ANITA CONVALESCENT HOSPITAL 55 17 SANTA CLARITA POST-ACUTE CARE CENTER - - SANTA FE LODGE 14 - SANTA MONICA CONVALESCENT CENTER II 16 - SANTA MONICA HEALTH CARE CENTER 10 or fewer - SANTA TERESITA MANOR 16 10 or fewer SEACREST POST-ACUTE CARE CENTER 10 or fewer - SHADOW HILLS CONVALESCENT HOSPITAL 10 or fewer 10 or fewer SHARON CARE CENTER 10 or fewer - SHERMAN OAKS HEALTH & REHABILITATION CENTER 12 10 or fewer SHERMAN VILLAGE HEALTHCARE CENTER - - SKYLINE HEALTHCARE CENTER-LOS ANGELES 10 or fewer - SOCAL POST-ACUTE CARE - - SOLHEIM SENIOR COMMUNITY 10 or fewer 10 or fewer SOUTH PASADENA CARE CENTER 79 14 SOUTHLAND 10 or fewer - ST. JOHN OF GOD RETIREMENT AND CARE CENTER - - STONEY POINT HEALTHCARE CENTER 33 10 or fewer STUDIO CITY REHABILITATION CENTER - 10 or fewer SUNNY VILLAGE CARE CENTER - - SUNNYSIDE NURSING CENTER 10 or fewer - SUNNYVIEW CARE CENTER 16 10 or fewer SUNRAY HEALTHCARE CENTER 33 13 SUNSET MANOR CONVALESCENT HOSPITAL - - SYLMAR HEALTH AND REHABILITATION CENTER 41 - SILVERADO SENIOR LIVING CALABASAS 48 10 or fewer SILVERADO SENIOR LIVING – BEVERLY PLACE 57 12 SOLHEIM SENIOR COMMUNITY 10 or fewer 10 or fewer SUNRISE ASSISTED LIVING OF STUDIO CITY 10 or fewer 10 or fewer SUNRISE VILLA CULVER CITY 10 or fewer 10 or fewer TARZANA HEALTH AND REHABILITATION CENTER 10 or fewer 10 or fewer TEMPLE CITY HEALTHCARE 10 or fewer - TEMPLE PARK CONVALESCENT HOSPITAL - - THE CALIFORNIAN - PASADENA CONVALESCENT HOSPITAL - - THE CARE CENTER ON HAZELTINE, LLC 10 or fewer - THE EARLWOOD 33 10 or fewer THE ELLISON JOHN TRANSITIONAL CARE CENTER 10 or fewer 10 or fewer THE GARDENS OF EL MONTE 19 10 or fewer THE GROVE POST-ACUTE CARE CENTER 43 12 THE MEADOWS POST ACUTE 44 14 THE ORCHARD - POST ACUTE CARE 33 10 or fewer THE REHABILITATION CENTER OF SANTA MONICA 37 12 THE REHABILITATION CENTRE OF BEVERLY HILLS 29 10 or fewer THE ROWLAND 10 or fewer - TOPANGA TERRACE - - TORRANCE CARE CENTER WEST, INC. 55 12 TORRANCE MEMORIAL MEDICAL CENTER D/P SNF 10 or fewer - THE KENSINGTON REDONDO BEACH 23 10 or fewer UNIVERSITY PARK HEALTHCARE CENTER 10 or fewer - VALLEY PALMS CARE CENTER 28 10 or fewer VALLEY VISTA NURSING AND TRANSITIONAL CARE LLC 10 or fewer - VERMONT HEALTHCARE CENTER 10 or fewer 10 or fewer VETERANS HOME OF CALIFORNIA - WEST LOS ANGELES 10 or fewer 10 or fewer VICTORIA CARE CENTER - - VIEW HEIGHTS CONVALESCENT HOSPITAL - - VIEW PARK CONVALESCENT CENTER 34 12 VILLA ELENA HEALTHCARE CENTER - - VILLA GARDENS HEALTH CARE UNIT - - VILLA SCALABRINI SPECIAL CARE UNIT 10 or fewer - VIRGIL REHABILITATION AND SKILLED NURSING CENTER 21 13 VISTA DEL SOL CARE CENTER - 10 or fewer VETERANS HOME OF CALIFORNIA-WLA 10 or fewer 10 or fewer VILLA GARDENS 16 10 or fewer WELLSPRINGS POST-ACUTE CENTER - - WEST COVINA HEALTHCARE CENTER - - WEST COVINA MEDICAL CENTER D/P SNF - - WEST HAVEN HEALTHCARE 10 or fewer 10 or fewer WEST HILLS HEALTH AND REHABILITATION CENTER 77 23 WEST VALLEY POST ACUTE 61 18 WESTERN CONVALESCENT HOSPITAL - - WESTLAKE CONVALESCENT HOSPITAL - - WHITTIER HILLS HEALTH CARE CENTER 10 or fewer 10 or fewer WHITTIER PACIFIC CARE CENTER 18 10 or fewer WINDSOR CARE CENTER OF CHEVIOT HILLS 53 10 or fewer WINDSOR CONVALESCENT CENTER OF NORTH LONG BEACH 10 or fewer 10 or fewer WINDSOR GARDENS CONVALESCENT CENTER OF HAWTHORNE 10 or fewer 10 or fewer WINDSOR GARDENS CONVALESCENT CENTER OF LONG BEACH - - WINDSOR GARDENS CONVALESCENT HOSPITAL 10 or fewer - WINDSOR GARDENS HEALTHCARE CENTER OF THE VALLEY 10 or fewer - WINDSOR MANOR - - WINDSOR TERRACE HEALTHCARE CENTER 38 10 or fewer WOODLAND CARE CENTER 10 or fewer - Show less The state last updated the list on May 29. Officials have withheld the precise number where there are 10 or fewer cases. The totals are cumulative counts. Lives lost to COVID-19 Learn more about those we've lost by reading Times obituaries of Californians who have died from coronavirus. Reopening the state California is currently in the second stage of Gov. Gavin Newsom's four-phase plan to gradually reopen the state amid the COVID-19 pandemic. Newsom's roadmap for reopening Stage 1 March 19 - May 7 Strictest restrictions in place. Stage 2 Began May 8 Lower-risk businesses can reopen with social distancing guidelines. Advanced Stage 2: Retail and dine-in restaurants are reopened with social distancing guidelines Stage 3 No date set Higher-risk businesses and venues can reopen with social distancing guidelines. Stage 4 No date set Concerts, conventions and sports with a live crowd can reopen. All of California's 58 counties have moved into Stage 2, including Los Angeles County. No restrictions lifted All restrictions lifted Hover for more information. Los AngelesLos AngelesSan DiegoSan DiegoSacramentoSacramentoSan FranciscoSan FranciscoReddingRedding What's open in every county We're tracking what's open, closed and restricted throughout the state in ten different categories, including parks, retail, restaurants and more. Find out what's open where you live. Our state in context The coronavirus has hit most of the U.S., with the largest concentrations in and around New York City. California, America's most populous state, has one of the highest totals. It ranks much lower after adjusting for population. State Cases Per 100k New cases FewerMore New York 369,660 1,884.2 Mar 1May 30 New Jersey 159,608 1,797 Illinois 118,917 927.5 California 109,982 280.9 Massachusetts 96,301 1,409.9 Pennsylvania 75,697 591.8 Texas 62,675 224.8 Michigan 56,969 572.1 Florida 55,424 269.1 Maryland 52,015 866.4 Georgia 46,331 449.9 Virginia 43,611 518.3 Connecticut 42,022 1,173.3 Louisiana 39,577 848.6 Ohio 35,033 300.9 Indiana 34,211 515.4 North Carolina 27,794 273.7 Colorado 26,084 471.6 Minnesota 24,190 437.6 Tennessee 22,566 339.3 Washington 21,349 292.7 Arizona 19,258 277.2 Iowa 19,244 614.3 Wisconsin 18,230 315.5 Alabama 17,359 356.8 Mississippi 15,229 509.5 Rhode Island 14,819 1,402.5 Nebraska 13,905 730 Missouri 13,298 218.4 South Carolina 11,394 229.9 Kentucky 9,704 218.5 Kansas 9,690 333.1 Utah 9,533 313 Delaware 9,422 992.3 District of Columbia 8,717 1,273.5 Nevada 8,517 291.4 New Mexico 7,624 364.4 Arkansas 7,013 234.5 Oklahoma 6,418 163.8 South Dakota 4,960 573.9 New Hampshire 4,492 334.3 Oregon 4,185 102.5 Puerto Rico 3,718 109.8 Idaho 2,803 166.1 North Dakota 2,554 339.5 Maine 2,282 171.2 West Virginia 1,989 108.7 Vermont 977 156.3 Wyoming 898 154.3 Hawaii 651 45.8 Montana 505 48.5 Alaska 433 58.6 Show less No state has had more deaths than New York, though its totals have been in decline in recent weeks. State Deaths Per 100k New deaths FewerMore New York 29,710 151.4 Mar 1May 30 New Jersey 11,634 131.0 Massachusetts 6,768 99.1 Pennsylvania 5,537 43.3 Michigan 5,464 54.9 Illinois 5,330 41.6 California 4,145 10.6 Connecticut 3,912 109.2 Louisiana 2,786 59.7 Maryland 2,509 41.8 Florida 2,447 11.9 Ohio 2,149 18.5 Indiana 2,125 32.0 Georgia 2,004 19.5 Texas 1,652 5.9 Colorado 1,443 26.1 Virginia 1,370 16.3 Washington 1,118 15.3 Minnesota 1,036 18.7 North Carolina 929 9.1 Arizona 904 13.0 Missouri 774 12.7 Mississippi 723 24.2 Rhode Island 711 67.3 Alabama 618 12.7 Wisconsin 588 10.2 Iowa 531 17.0 South Carolina 487 9.8 District of Columbia 462 67.5 Kentucky 431 9.7 Nevada 417 14.3 Tennessee 364 5.5 Delaware 361 38.0 New Mexico 351 16.8 Oklahoma 334 8.5 New Hampshire 238 17.7 Kansas 215 7.4 Nebraska 170 8.9 Oregon 153 3.7 Arkansas 133 4.4 Puerto Rico 133 3.9 Utah 112 3.7 Maine 89 6.7 Idaho 82 4.9 West Virginia 75 4.1 South Dakota 62 7.2 North Dakota 60 8.0 Vermont 55 8.8 Hawaii 17 1.2 Montana 17 1.6 Wyoming 16 2.7 Alaska 10 1.4 Show less Tracking the coronavirus California counties Alameda Contra Costa Fresno Imperial Kern Kings Los Angeles Orange Riverside Sacramento San Bernardino San Diego San Francisco San Joaquin San Mateo Santa Barbara Santa Clara Sonoma Tulare Ventura Other trackers Beach closures Housing homeless people Reopenings by county The lives lost More coverage Symptoms How it spreads Get our newsletter About the numbers This page was created by Swetha Kannan, Casey Miller, Sean Greene, Lorena Iñiguez Elebee, Rong-Gong Lin II, Ryan Murphy, Melody Gutierrez, Priya Krishnakumar, Sandhya Kambhampati, Maloy Moore, Jennifer Lu, Aida Ylanan, Vanessa Martínez, Ryan Menezes, Thomas Suh Lauder, Andrea Roberson, Ben Poston, Nicole Santa Cruz, Iris Lee, Rahul Mukherjee, Jaclyn Cosgrove, Anthony Pesce, Paul Duginski and Phi Do. State and county totals come from a continual Times survey of California's 58 county health agencies as well as the three run by cities. Those figures are ahead of the totals periodically released by the state's Department of Public Health. State officials acknowledge that their tallies lag behind the updates posted by local agencies throughout the day and do not dispute The Times' method. The Times switched to using this method on March 18, leading to increases over what it had published previously using state data. The tallies here are mostly limited to residents of California, which is the standard method used to count patients by the state’s health authorities. Those totals do not include people from other states who are quarantined here, such as the passengers and crew of the Grand Princess cruise ship that docked in Oakland. In an effort to aid scientists and researchers in the fight against COVID-19, The Times has released its database of California coronavirus cases to the public. The database is available on Github, a popular website for hosting data and computer code. The files will be updated daily at github.com/datadesk/california-coronavirus-data. Closures and restrictions are drawn from an ongoing Times survey of county governments. National and global case data are collected by the the Centers for Disease Control and Prevention and researchers at the Johns Hopkins University Center for Systems Science and Engineering. If you see information here that you believe is incorrect or out of date, please contact Data and Graphics Editor Ben Welsh. https://www.latimes.com/projects/california-coronavirus-cases-tracking-outbreak/
-
434 Cumulative (includes recovered cases) Total Recovered Cases 368 Total Hospitalizations 47 Cumulative (does not reflect current stays) Total Deaths 10 https://coronavirus-response-alaska-dhss.hub.arcgis.com/
-
https://health.wyo.gov/publichealth/infectious-disease-epidemiology-unit/disease/novel-coronavirus/covid-19-map-and-statistics/
-
https://montana.maps.arcgis.com/apps/MapSeries/index.html?appid=7c34f3412536439491adcc2103421d4b
-
HAWAII COVID-19 CASES Cumulative totals as of 12:00 noon on May 30, 2020 Statewide COVID-19 Positive* Cases Total Cases 651†† (3 newly reported) Released from Isolation† 606 Required Hospitalization 83 Deaths 17 https://health.hawaii.gov/coronavirusdisease2019/what-you-should-know/current-situation-in-hawaii/
-
https://www.health.nd.gov/diseases-conditions/coronavirus/north-dakota-coronavirus-cases